Chapter 4 Dissociating facial electromyographic correlates of visual and verbal induced rumination
revious research showed that mental rumination, considered as a form of repetitive and negative inner speech, is associated with increased facial muscular activity. However, the relation between these muscular activations and the underlying mental processes is still unclear. In this study, we tried to disentangle the facial electromyographic correlates of induced rumination that were related to either i) mechanisms of (inner) speech production or ii) rumination as a state of pondering on negative affects. To this end, we compared two types of rumination induction. The first one was designed to specifically induce rumination in a verbal modality whereas the second one was designed to induce rumination in a visual modality. Following the motor simulation view of inner speech production, we hypothesised that the verbal rumination induction should result in higher activity in the speech-related muscles than the non-verbal rumination induction. We also hypothesised that a relaxation focused on the orofacial area should be more efficient in reducing rumination (when experienced in a verbal modality) than a relaxation focused on a non-orofacial area. Our results do not corroborate these hypotheses, as we did not find modality-specific electromygraphic correlates of rumination. Moreover, the two relaxation types were similarly efficient in reducing rumination, whatsoever the rumination modality. We discuss these results in relation to the inner speech literature and suggest that because rumination is a habitual and automatic form of emotion regulation, it might be considered as a particularly (strongly) internalised and condensed form of inner speech.27
4.1 Introduction
The phenomenon of inner speech has been attracting the attention of the philosophical and scientific communities for a long time. This interest might be explained by the paradox surrounding inner speech: whereas most individuals experience it on a daily basis (but see Hurlburt, 2011), inner speech is notably difficult to investigate. However, much can be learned about inner speech by examining its different forms of expression. Among these forms is rumination, which, for several reasons, will be the focus of this paper. First, although rumination is common in general population (E. R. Watkins et al., 2005), it can precede serious mental disorders such as depression, anxiety, eating disorders, or alcohol abuse (for review, see Nolen-Hoeksema et al., 2008). Therefore, understanding the fundamental nature of rumination have important implications for clinical practice. Second, rumination is a repetitive phenomenon which can be induced and sustained for a relatively long period of time, making it easier to capture than more elusive forms of inner speech. With the aim of further exploring the nature of rumination, we present the results of a procedure designed to induce rumination in different modalities (verbal versus visual imagery) and to investigate its modality-specific electromyographic correlates.
4.1.1 Rumination: its definition, functions and consequences
Rumination can be broadly defined as unconstructive repetitive thinking about past events and current mood states (Martin & Tesser, 1996). This general definition encompasses different conceptualisations that have been proposed during the last decades. Among the most influential frameworks is the Response Style Theory (RST, Nolen-Hoeksema, 1991; Nolen-Hoeksema et al., 2008). Within this theory, rumination is described as a behavioural pattern that is characterised by perseverative, repetitive and passive thoughts. According to the RST, individuals who are experiencing rumination are repetitively focusing on their negative emotional state, on the fact that they are feeling depressed, and on the causes and consequences of their symptoms (Nolen-Hoeksema, 1991). In this framework, rumination is viewed as a type of response to distress or a coping mechanism which involves focusing the attention on oneself and one’s current emotional state (Nolen-Hoeksema, 1991). Alloy, Robinson and colleagues (Alloy et al., 2000; Robinson & Alloy, 2003; Smith & Alloy, 2009) subsequently appended stress-reactive rumination to this theory, suggesting that rumination can also appear following stressful life events and before the presence of negative affect. When conceptualised in this manner, it is presumed that rumination can occur before the start of the depressive mood, whereas rumination, as conceptualised by Nolen-Hoeksema (1991), happens as a response to depressive mood. Overall, empirical research suggest that negative affect is an essential part of the ruminative thinking process (e.g., Nolen-Hoeksema & Morrow, 1993).
Based on different factor analyses and more recent models of rumination, a distinction between harmful and helpful sub-types of rumination has been introduced (e.g., Smith & Alloy, 2009; Watkins, 2008). For instance, a distinction has been suggested between brooding and reflection (Treynor et al., 2003). Brooding relates to morose pondering along with the passive comparison of one’s current circumstances and a certain standard. In contrast, ruminative reflection denotes contemplation and engagement in cognitive problem solving as a means to mitigate one’s depressive symptoms. In the same vein, Watkins (2008) proposed a model for differentiating between harmful and helpful forms of repetitive thought. He argued that repetitive thoughts vary along three dimensions – valence, context and level of construal (abstract versus concrete). By this account, depressive rumination is characterised by an abstract mode of processing that involves thinking about the causes, meaning, and consequences of feelings or events. This abstract-analytic mode is opposed to a more concrete and helpful mode of processing information focused on direct, detailed and concrete experience. The processing mode theory is supported by experimental evidence showing that an abstract-analytical mode of processing is particularly deleterious for mood and cognition (Watkins, 2008).
A certain level of overlap between rumination and related constructs such as intrusive thoughts, obsessions or worry has been recognised (e.g., Olatunji, Naragon-Gainey, & Wolitzky-Taylor, 2013; Smith & Alloy, 2009). Accordingly, rumination and worry have been suggested to represent a particular form of a broader transdiagnostic process coined as unconstructive repetitive thinking (Olatunji et al., 2013; Watkins, 2008), perseverative cognition (Brosschot, Gerin, & Thayer, 2006) or repetitive negative thinking (Ehring & Watkins, 2008). All forms of thinking gathered under these umbrella terms share a broad involvement of self-focused repetitive thinking about negative and self-relevant topics (De Raedt, Hertel, & Watkins, 2015). However, one the most important and robust delimitation is the one between worry and rumination. On the whole, it is suggested that worry and rumination can be distinguished by their content and by their temporal orientation (Watkins, 2008), but that the processes underlying them would be similar. More precisely, whereas worry is focused on problem solving and future events, (depressive) rumination is rather passive and past-oriented (Nolen-Hoeksema et al., 2008; Smith & Alloy, 2009). There are also findings suggesting that worry is typically more verbal than rumination (Lawrence et al., 2018), although some studies did not find this difference (Watkins et al., 2005).
Having briefly defined the functions and consequences of rumination, we now turn to a discussion of the nature of ruminative thinking, its phenomenological properties as well as how it can be induced and measured in a controlled environment.
4.1.2 The nature of ruminative thoughts
Rumination has sometimes been portrayed as a form of inner speech (Perrone-Bertolotti et al., 2014) due to its predominantly verbal character (Ehring & Watkins, 2008; Goldwin & Behar, 2012; Goldwin et al., 2013; McLaughlin et al., 2007). In other words, while ruminating, individuals are most often silently talking to themselves. However, what inner speech precisely entails is still debated (for a recent review, see Lœvenbruck et al., 2018). In the present paper, we examine the motor simulation view of inner speech production. Under this view, inner speech (content) is proposed to be the result of a soundless mental simulation of overt speech (Jeannerod, 2006; Postma & Noordanus, 1996). More precisely, inner speech is conceived as (inhibited) speech motor acts that trigger –via a simulation or an emulation mechanism– multimodal sensory percepts (Lœvenbruck et al., 2018). This perspective entails that the speech motor system should be involved during inner speech production and that we could record a peripheral residual activity in the speech muscles. This hypothesis has been corroborated by several studies using orofacial surface electromyography (EMG) during tasks that involve inner speech production such as silent recitation, verbal mental imagery or problem solving (Jacobson, 1931; Livesay et al., 1996; McGuigan & Dollins, 1989; Sokolov, 1972). Overall, these studies show that inner speech production is usually associated with an increased activity of the speech muscles.
We recently conducted a study to examine the facial EMG correlates of rumination (Nalborczyk et al., 2017). We have demonstrated that induced rumination is accompanied by an increased facial EMG activity concurrent with increased self-reported levels of state rumination, as compared with an initial relaxed state. This increase in facial EMG activity as a correlate of induced rumination was taken as suggestive evidence that verbal rumination does involve the speech motor system. Furthermore, after a relaxation session focused on the orofacial area, we observed a larger decrease in self-reported state rumination than after non-orofacial (focused on the forearm) relaxation. We interpreted these findings as consistent with the motor simulation view. However, we opened the possibility that participants of this study could have been experiencing rumination in other (non-verbal) modalities, such as rumination in visual mental images. Therefore, the present work is in continuity with our previous study, seeking to further investigate the electromyographic correlates of different rumination modalities (i.e., verbal vs. visual imagery).
Despite being predominantly experienced in a verbal modality, rumination can also be experienced as visual imagery (Goldwin & Behar, 2012; Newby & Moulds, 2012; Pearson et al., 2008). Visual imagery refers to a process during which perceptual information is retrieved from long-term memory, resulting in the experience of “seeing with the mind’s eye” (Ganis et al., 2004). It has been suggested that because rumination is usually past-oriented, it should increase access to (negative) autobiographical memories (Lyubomirsky et al., 1998). Moreover, because autobiographical memories are often experienced as visual images, rumination should likewise include visual features (Pearson et al., 2008). Several studies have obtained results that are consistent with this claim. Among a sample of patients who were diagnosed as clinically depressed, a significant majority (94.7% and more than 70%) reported that rumination combined verbal and sensory elements, among which visual imagery (Newby & Moulds, 2012; Pearson et al., 2008, respectively). When unselected individuals were asked about the quality of their rumination directly while ruminating, 60.53% of them said they had been experiencing verbal thoughts and 35.92% mental images (McLaughlin et al., 2007). Another study comparing naturally occurring depressive and anxious thoughts in a non-clinical sample, found that depressive thoughts involved more images than anxious thoughts (Papageorgiou & Wells, 1999). In addition, a recent study demonstrated that a considerable number of people experience depressive cognition in a visual form (Lawrence et al., 2018). Furthermore, this study showed that individuals with a visual depressive cognitive style reported a similar amount of rumination as individuals with a verbal style. Overall, the existing literature indicates that rumination can have visual features, despite being predominantly verbal.
There are several reasons to think this distinction is of importance. First of all, mental imagery is usually related to a greater cardiovascular activation than verbal thoughts. This is specifically the case in the stressor-focused concrete visual rumination study, for individuals with high trait rumination (Zoccola et al., 2014), although a later study found higher heart rate during verbal thoughts (Woody et al., 2015). Authors interpreted the obtained data by connecting it with the cognitive avoidance theory (Sibrava & Borkovec, 2006). According to this theory, worry, as a primarily linguistic repetitive thought, is an avoidance response whose goal is to restrain aversive images, thus reducing somatic activation and processing of emotions. Similarly, forming negative mental visual images has been shown to lead to a greater increase in anxiety in comparison to forming negative descriptive sentences (Holmes & Mathews, 2005). Taken together, these findings suggest that different modes of rumination could have different effects on individuals. Furthermore, if rumination also has a visual quality, imagery-based therapeutic methods could also be beneficial (Pearson et al., 2008). This idea is supported by studies showing the effectiveness of mental imagery in accessing and modifying emotion in therapy (for an overview, see Hackmann & Holmes, 2004). On the whole, investigating the verbal and visual features of rumination could contribute to sharpen our understanding of the ruminative processes and lead to better-adapted therapeutic strategies.
4.1.3 Inducing rumination in a controlled environment
Rumination can be operationalised either as a trait, a stable response style of an individual (Nolen-Hoeksema, 1991), or as an ongoing process or a state. When considered as a trait, individual differences in rumination have been mostly investigated by means of questionnaires. The most widely used instrument is the Ruminative Responses Scale (RRS) of the Response Styles Questionnaire (RSQ, Nolen-Hoeksema & Morrow, 1991). Participants are asked to rate how often they encounter these thoughts or behaviours when feeling sad or depressed. The short version of the RRS questionnaire comprises two scales, reflection and brooding (Treynor et al., 2003). The psychometric characteristics of this scale as well as its relationship with depressive symptoms have been extensively studied (for a review, see Nolen-Hoeksema et al., 2008).
However, self-report measures of rumination have several shortcomings. These measurements can be vulnerable to intents and subjectivity of the participants. They rely on the evaluation of past experience and do not focus on the fact that rumination usually arises in the presence of negative emotion. On the opposite, physiological studies of rumination provide data on rumination as it occurs as well as objective data that are less predisposed to subjective influences. Physiological measures also provide an opportunity to explore underlying mechanisms and central processes (Siegle & Thayer, 2003). For this purpose, several protocols set to induce rumination have been devised.
Experimental protocols for inducing rumination usually start with provoking negative mood in participants. To this end, some researchers employed sad music (e.g., Conway, Csank, Holm, & Blake, 2000), asked participants to recall a sad event (e.g., Rood et al., 2012), or put participants in stressful and frustrating situations such as an extremely difficult IQ test (e.g., Nalborczyk et al., 2017). Another study tried to cause negative feelings by asking participants to give a speech while being evaluated, though the authors concluded that this stressor was rather mild (Zoccola et al., 2014). In the following step, rumination is induced. Most studies have employed the rumination induction procedure developed by Nolen-Hoeksema & Morrow (1993). Within this protocol, participants are asked to focus on the meanings, causes, and consequences of their current feelings for eight minutes, while being prompted with a series of sentences. Other studies used either a modified version of this protocol (e.g., Nalborczyk et al., 2017) or original prompts designed for a specific experiment, but still following the same general idea (Rood et al., 2012; Zoccola et al., 2014). Similarly, in some studies investigating the differences between worry and rumination, participants were given an explanation of what worry or rumination is and were subsequently asked to engage in it (Goldwin & Behar, 2012; McLaughlin et al., 2007).
Experimental protocols have also used different means for exploring the characteristics of the ongoing process of rumination. In some studies (e.g., Goldwin & Behar, 2012; McLaughlin et al., 2007), participants were interrupted and asked about the features and/or content of their thoughts. Other studies used questionnaires to measure the features of the ongoing cognition (Makovac et al., 2018). Among other characteristics, several studies explored how much the ongoing inner experience was verbal and visual, without manipulating rumination modality. In a few studies, however, experimental protocols have been specifically set out to manipulate this aspect of rumination.
Some of the few studies specifically manipulating verbal and visual rumination were carried out by Zoccola and colleagues (Woody et al., 2015; Zoccola et al., 2014). The verbal or visual form of rumination (or mentation type as these authors refer to it) was induced by playing audio tapes that directed participants’ thoughts. Prompts were similar in both conditions, differing only in the verbal/visual instruction (“Recall the speech task using words, phrases, and sentences.” vs. “Recall the speech task using pictures and images.”). Participants were subsequently asked to estimate the proportion of verbal thoughts and mental visual images. Although not directly focused on rumination, the task developed by Holmes, Mathews, Mackintosh, & Dalgleish (2008) is quite inspiring in designing a protocol for exploring rumination in different modalities. These authors aimed to compare verbal and imagery processing in terms of their differential effects on emotion. They noticed that previous procedures provided verbal descriptions of the events that needed to be processed verbally or visually. The authors argued that with such descriptions, the imagery condition has an additional processing mode in comparison to the verbal condition. Their proposed solution was to combine pictorial and verbal cues and to ask participants to integrate them into either a sentence or an image.
Finally, it should be noted that in none of the studies in which thinking modality was manipulated, did the participants solely use one type of thought. Even though participants in the imagery group of Zoccola et al. (2014) reported higher levels of mental images in comparison to the participants in the verbal group, the latter group also reported a certain level of mental imagery. This is in line with studies showing that rumination includes both verbal and visual components (e.g., Goldwin & Behar, 2012; McLaughlin et al., 2007), implying that it is not exclusively experienced in one modality. These results are substantiated by a recent study which has shown that participants generate visual images both in cases where they were told to visualise or to verbally think, while they have strong verbal representations only when asked to verbally think (Amit et al., 2017). Amit et al. (2017) concluded that there is a difference in volitional control of verbal and visual thinking and that people have better control over inner speech than visual thought. Therefore, we will focus on the relative use of a specific mode of thought rather than trying to induce completely verbal or visual thought.
4.1.4 The present study
It has been suggested that there is a need for studies that would induce verbal or visual rumination in order to inspect how the experience of rumination in these two modalities could differ (Lawrence et al., 2018). Furthermore, there has only been one set of studies, to the best of our knowledge, that has employed a protocol for specifically inducing verbal or visual rumination (Woody et al., 2015; Zoccola et al., 2014). In addition, there were certain shortcomings in this protocol, some of which were highlighted by the authors, such as the stress induction component. To tackle these issues, we extended the study presented in Nalborczyk et al. (2017) by inducing rumination in distinct modalities to compare their electromyographic correlates.
As previously (Nalborczyk et al., 2017), we followed two steps in our protocol. First, either verbal or visual rumination was induced in participants by putting them in a stressful situation and subsequently asking them to think about the causes, consequences of their feelings during that situation. Based on the task developed by Holmes et al. (2008), instructions were presented by combining pictorial and verbal cues. During this period, we tracked changes in the EMG activity of several facial muscles and monitored self-reported levels of state rumination. Second, we compared the effects of two types of relaxation in relation to the modality of ruminative thoughts, on both the EMG amplitude and the self-reported levels of state rumination.
Several hypotheses were drawn based on the existing literature. First, we expected participants in the verbal rumination condition to report a larger proportion of verbal content in their inner experience and a lesser amount of visual content (in comparison to participants in the non-verbal rumination group). Second, with respect to peripheral muscular activity, we expected the activity in the speech muscles to increase by a greater amount in the verbal rumination condition, whereas the change in the non-speech muscles should occur similarly in both conditions, since both conditions are expected to cause negative emotions to a similar extent. Moreover, the control forearm muscle activity should not vary distinctively between conditions. Third, regarding the different types of relaxation, we hypothesised that both orofacial and arm relaxation should cause a slight decrease of state rumination in the verbal condition. Nevertheless, we expected a stronger decrease in the orofacial relaxation condition as compared to the forearm relaxation.
4.2 Methods
In the Methods and Data analysis sections, we report how we determined our sample size, all data exclusions, all manipulations, and all measures in the study (Simmons, Nelson, & Simonsohn, 2012). A pre-registered version of our protocol can be found online: https://osf.io/c9pag/.
4.2.1 Participants
Our sample included 85 female participants, ranging in age from 18 to 31 years (M = 19.88, SD = 2.02). We chose to include only female participants in the present study, for the following three reasons. First, women have been found to engage in rumination more than men (Johnson & Whisman, 2013). Second, in comparison with men, women have greater visual imagery abilities and report more vivid mental visual images (as reviewed in Lawrence et al., 2018). Third, the distribution of gender is very unbalanced in Psychology courses. Therefore, it would be practically impossible to have a well-balanced sample with respect to gender. All participants attended undergraduate Psychology programs at Univ. Grenoble Alpes. They were all native speakers of French, had no history of psychiatric or neurological disorders, speech disorders or hearing deficits. Another inclusion criterion was that participants had no depressive symptoms. This was tested at the beginning of the experiment using the Center for Epidemiologic Studies – Depression scale (CES-D, Radloff, 1977). Those participants whose scores overstepped the threshold did not proceed to the main part of the experiment (N = 16). Instead, they were debriefed and received information about places they could turn to for counselling.
Participants were recruited through the university website. They were told that the goal of the study was to test a French adaptation of a novel intelligence test and were, therefore, blind to the actual goal of the study. Participants received course credits for their participation and were fully debriefed at the end of the experiment. Written consent was obtained from each participant and the study received an approval from the local ethical committee (CERNI, Amendement-2018-02-06-23, Avis-2015-03-03-61).
As described in the preregistration form, we used sequential testing to determine the appropriate sample size. More precisely, we recruited participants until reaching either a predetermined level of precision (this procedure is described in Kruschke, 2015) or the end of the period of time allocated to this experiment (fixed to eight weeks). We first determined a region of practical equivalence (ROPE) and a target precision level on the main effect of interest (i.e., the interaction between the effect of time (baseline versus post-induction, within-subject) and group (verbal rumination versus visual rumination induction, between-subject design), on the EMG amplitude of the OOI muscle). We recruited participants until the 95% credible interval (the Bayesian analogue of a confidence interval) around the parameter of interest was at least 0.8 times narrower than the ROPE. The ROPE can be defined as the region comprising the effect sizes that we consider as “null effects” (alternatively, it defines the minimum effect size of interest). We defined the ROPE as [-0.1, 0.1] on the scale of the normalised and baseline-standardised EMG amplitude. This ROPE has been defined to correspond to a “null effect” based on previous EMG data we had collected on control muscles (forearm). Then, we defined the target precision as 0.8 times the width of the ROPE, that is: \(0.8 \times 0.2 = 0.16\). We did not reach this threshold within the allocated time. Thus, we ran the study for the full eight weeks (details on the evolution of the estimation precision can be found in the supplementary materials).
4.2.2 Material
The experimental procedure was developed using the OpenSesame software (Mathôt, Schreij, & Theeuwes, 2012) and stimuli were displayed on a DELL computer screen of size 1280px*720px. TrignoTM Mini wireless sensors (Delsys Inc.) were used for the detection of the surface EMG signals. These sensors consist of a bigger and a smaller box. The smaller box contains two 5x1mm parallel electrode bars with 10mm between them that record bipolar muscle activation. For facial EMG, the small box with electrodes was attached to the face and the bigger box was usually placed on the side of the neck. Concerning the forearm EMG, both boxes were placed on the forearm. Both boxes were attached by double-sided adhesive tape. Before setting the sensors, the skin was cleaned by Nuprep scrubbing gel and by alcohol wipes. Signal acquisition and synchronisation was done using the PowerLab 16/35 (ADInstrument, PL3516) device with a sampling rate of 1000 Hz. In addition to EMG measurements, the audio signal was simultaneously recorded using a C1000S AKG microphone which was placed 20-30 cm away from the participant. The audio signal was amplified using a Berhringer Tube Ultragain MIC100 amplifier. It was synchronised with the EMG signals using trigger signals. The experiment was video-monitored using a Sony HDR-CX240E camera. These recordings were taken in order to track any vocal or behavioural artifacts during periods of interest (i.e., baseline, rumination and relaxation). Labchart 8 software (ADInstrument, MLU60/8) was used for EMG and audio data collecting and processing.
Our exploration focused on the muscles that have already been found to be activated during covert or overt speech (e.g., Laurent et al., 2016; Maier-Hein, Metze, Schultz, & Waibel, 2005; Schultz & Wand, 2010). With surface EMG, it is difficult to precisely relate a given skin position to a specific muscle. However, as authors often refer to the facial positions as muscle positions, we will follow this tradition for clarity. Because of their involvement in speech production, bipolar surface EMG electrodes were positioned on the orbicularis oris inferior (OOI), the zygomaticus major (ZYG) and the neck muscles (NCK). In addition, electrodes were also placed on the frontalis (FRO) as a non-speech but emotion-related muscle. Finally, we positioned a sensor on the flexor carpi radialis (FCR) to control for general (whole body) muscle contraction.
Speech-related sensors were positioned on the right side of the face whereas the emotion-related (forehead) sensor was positioned on the left side of participants’ faces, following studies that found larger movements of the right side of the mouth during speech production (Nicholls & Searle, 2006), and more emotional expression on the left side of the face (Nicholls, Ellis, Clement, & Yoshino, 2004). Since participants were asked to use a mouse to provide answers, the forearm sensor was positioned on the non-dominant forearm (that participants did not use to provide the answer).
4.2.3 Procedure
We formed two groups based on the modality participants were asked to ruminate in. Hereafter these groups will be referred to as verbal and visual. Participants were also divided based on the type of relaxation they were listening to, that is, an orofacial relaxation, or an arm relaxation. As a result, there were four groups in the experiment: verbal – orofacial, verbal – arm, visual – orofacial, and visual – arm.
4.2.3.1 Trait questionaires
After filling the consent form, participants were asked to complete the CES-D (Radloff, 1977). Participants also filled in the short version of the Ruminative Response Scale (RRS, Treynor et al., 2003), adapted and validated in French (Douilliez, Guimpel, Baeyens, & Philippot, in preparation). These questionnaires were filled in paper format. Once it was determined that they could participate in the study (i.e., that they did not exceed the threshold for depressive symptoms on the CES-D), participants were equipped with the EMG sensors.
4.2.3.2 State questionaires
Subsequently, a calibration was carried out, making sure that the sensors on each muscle were suitably detecting signals. Participants were then explained the Visual Analogue Scales (VASs) that were used to obtain various self reports throughout the experiment. Specifically, we explained what we meant by: At this moment, my thoughts are presented in the form of words (VAS Verbal), and At this moment, my thoughts are presented in the form of visual mental images (VAS Visual). To assess the level of state rumination, we used a French translation of the Brief State Rumination Inventory (BSRI, Marchetti et al., 2018), composed of eight items also presented as VASs. From that point, the rest of the stimuli were presented on the computer screen and speakers, and the experimenter (blind to the condition) did not interact with the participants anymore.
4.2.3.3 Baseline measurements
Afterwards, participants listened to a guided relaxation (not focused on any specific muscle). The purpose of this relaxation was to minimise inter-individual variability of the initial mood states and to help participants to relax and get used to wearing the EMG sensors. The recording comprised 240 seconds of guided relaxation, then a pause was made during which participants were told to continue relaxing and the baseline EMG measurements were recorded, after which the guided relaxation continued for another 30 seconds. Following this, participants baseline level of state rumination, verbal and visual level of thoughts were measured using the VASs.
4.2.3.4 Imagery training
Next, participants went through a “lemon training” based on the task proposed by Holmes et al. (2008). The objective of this training was to show the participants precisely what was meant by thinking in words or thinking in pictures. The participants in the verbal group were asked to combine an image and a word imagining a sentence in their head, whereas participants in the visual group were asked to do the same, but only imagining a picture. There were two trials. After doing this task, participants rated how clear (how vivid) their sentence or image was, following which they had to say or describe it out loud. This served as a verification that participants did the task and that they understood it.
4.2.3.5 Stress induction
Afterwards, participants took the intelligence test. The test comprised 18 verbal and 18 spatial intelligence questions. It was designed in a way that most (13/18) questions were very difficult while also containing certain (5/18) items that were relatively easy, in order not to demotivate the participants. Participants were instructed to provide their answer within 30 seconds. The number of questions was selected so that even if participants replied very fast, they still encountered around 15 minutes of this frustrating situation. This manipulation has already been shown successful in inducing a negative mood (Nalborczyk et al., 2017).
4.2.3.6 Rumination induction
When the test was done, participants were asked to think about the causes, meanings and consequences of their performance during the test and of their current feelings, while their IQ score was being calculated. The participants in the verbal group were asked to do this with their inner voice and the participants in the visual group using mental visual images. Following Holmes et al. (2008)’s task, the instructions were presented in written format together with an image showing a person thinking in words (in the verbal group) or in pictures (in the visual group). When ready, participants pressed the key and a loading sign showed on their screen which lasted for 5 minutes during which participants were expected to ruminate either using inner speech or mental images. When this period was done, participants were again presented with the VASs.
4.2.3.7 Muscle-specific relaxation
Finally, participants listened again to a guided relaxation, only this time there were two types of relaxation. One half of verbal and one half of visual group were assigned to an orofacial relaxation group and they listened to the relaxation that was focused on the mouth. The other two halves of both groups were randomly assigned to an arm relaxation group and they listened to the relaxation concentrated on the arm. Both relaxations had a similar structure with around 270 seconds of guidance, 60 seconds of pause during which the EMG measurements were performed and 25 seconds of relaxation closure. At the very end, participants were asked to write down what they thought was the goal of the experiment and what they were thinking during the score calculation (i.e., the rumination period). The first question served to assess a potential compliance bias insofar as due to the goal of the experiment (i.e., manipulation of the rumination modality), we could not make participants completely blind to the task. The second question served again to check how much participants followed the instruction. At the end of the experiment, participants were given an exhaustive debriefing explaining the goals of the research.
4.2.4 EMG signal processing
Data were collected using Labchart8 and were subsequently exported to Matlab for signal processing (www.mathworks.fr, Matlab r2015a, version 8.5.0.197613). First, a 50Hz frequency comb filter was applied to eliminate power noise. Then, in keeping with the recommendation for facial EMG studies (De Luca et al., 2010), a 20 Hz – 450 Hz bandpass filter was applied, in order to focus on the facial EMG frequency band. The EMG signal was centered to its mean and cut with respect to the three periods of interest (i.e., baseline, rumination and relaxation period), all of which were divided into 5s blocks. These data were then exported to R version 3.5.0 (R Core Team, 2018), where the mean of the absolute signal was calculated for each 5s block. Thus, a score for each muscle, in each period, for each participant was calculated. Absolute EMG values are not meaningful as muscle activation is never null, even in resting conditions, due in part to physiological noise. In addition, there are inter-individual variations in the amount of EMG amplitude in the baseline. To normalise for baseline amplitude across participants, we thus subtracted the EMG amplitude of the baseline to the two periods of interest (i.e., after rumination and after relaxation) and divided it by the variability of the signal at baseline for each muscle and each participant.
Although participants were given the instruction to remain still and to avoid unnecessary movements, there were a lot of subtle movements (e.g., biting the lips). The blocks containing these artifacts were removed from the analysis. This was done by inspecting all recordings and manually removing blocks during which there were visually obvious bursts of the EMG amplitude.
4.2.5 Data analysis
Statistical analyses were conducted using R version 3.5.0 (R Core Team, 2018), and are reported with the papaja (Aust & Barth, 2018) and knitr (Xie, 2018) packages.
To model EMG amplitude variations in response to the rumination induction, we fitted a Bayesian multivariate regression model with the standardised EMG amplitude as an outcome and Group as a categorical predictor (contrast-coded). We used the same strategy for modelling the interaction effect between the type of induction and the type of rumination induction.28 These analyses were conducted using the brms package (Bürkner, 2018b), an R implementation of Bayesian multilevel models that employs the probabilistic programming language Stan (Carpenter et al., 2017).
Stan implements gradient-based Markov Chain Monte Carlo (MCMC) algorithms, which allow yielding posterior distributions that are straightforward to use for interval estimation around all parameters. Four chains were run for each model, including each 10.000 iterations and a warmup of 2.000 iterations. Posterior convergence was assessed examining autocorrelation and trace plots, as well as the Gelman-Rubin statistic. Constant effects estimates were summarised via their posterior mean and 95% credible interval (CrI), where a credible interval interval can be considered as the Bayesian analogue of a classical confidence interval, except that it can be interpreted in a probabilistic way (contrary to confidence intervals). When applicable, we also report Bayes factors (BFs) computed using the Savage-Dickey method.29 These BFs can be interpreted as updating factors, from prior knowledge (what we knew before seeing the data) to posterior knowledge (what we know after seeing the data).
4.3 Results
The results section is divided into two sections investigating the effects of i) the type of rumination induction and ii) the interaction effect between the type of rumination induction and the type of relaxation. Each section is further divided into two subsections reporting either confirmatory (preregistered) or exploratory (non-preregistered) analyses.
4.3.1 Effects of the rumination induction and rumination modality
4.3.1.1 Descriptive statistics and figures
We represent the standardised EMG amplitude during the rumination period for each facial muscle in Figure 4.1. This figure reveals that the average standardised EMG amplitude was higher than baseline after the rumination induction for both the OOI and FRO muscles, while it was at the baseline level (on average) for the ZYG and lower than baseline for the NCK. Overall, this figures does not show any group (modality-specific) differences (detailed numerical descriptive statistics are reported in the supplementary materials).
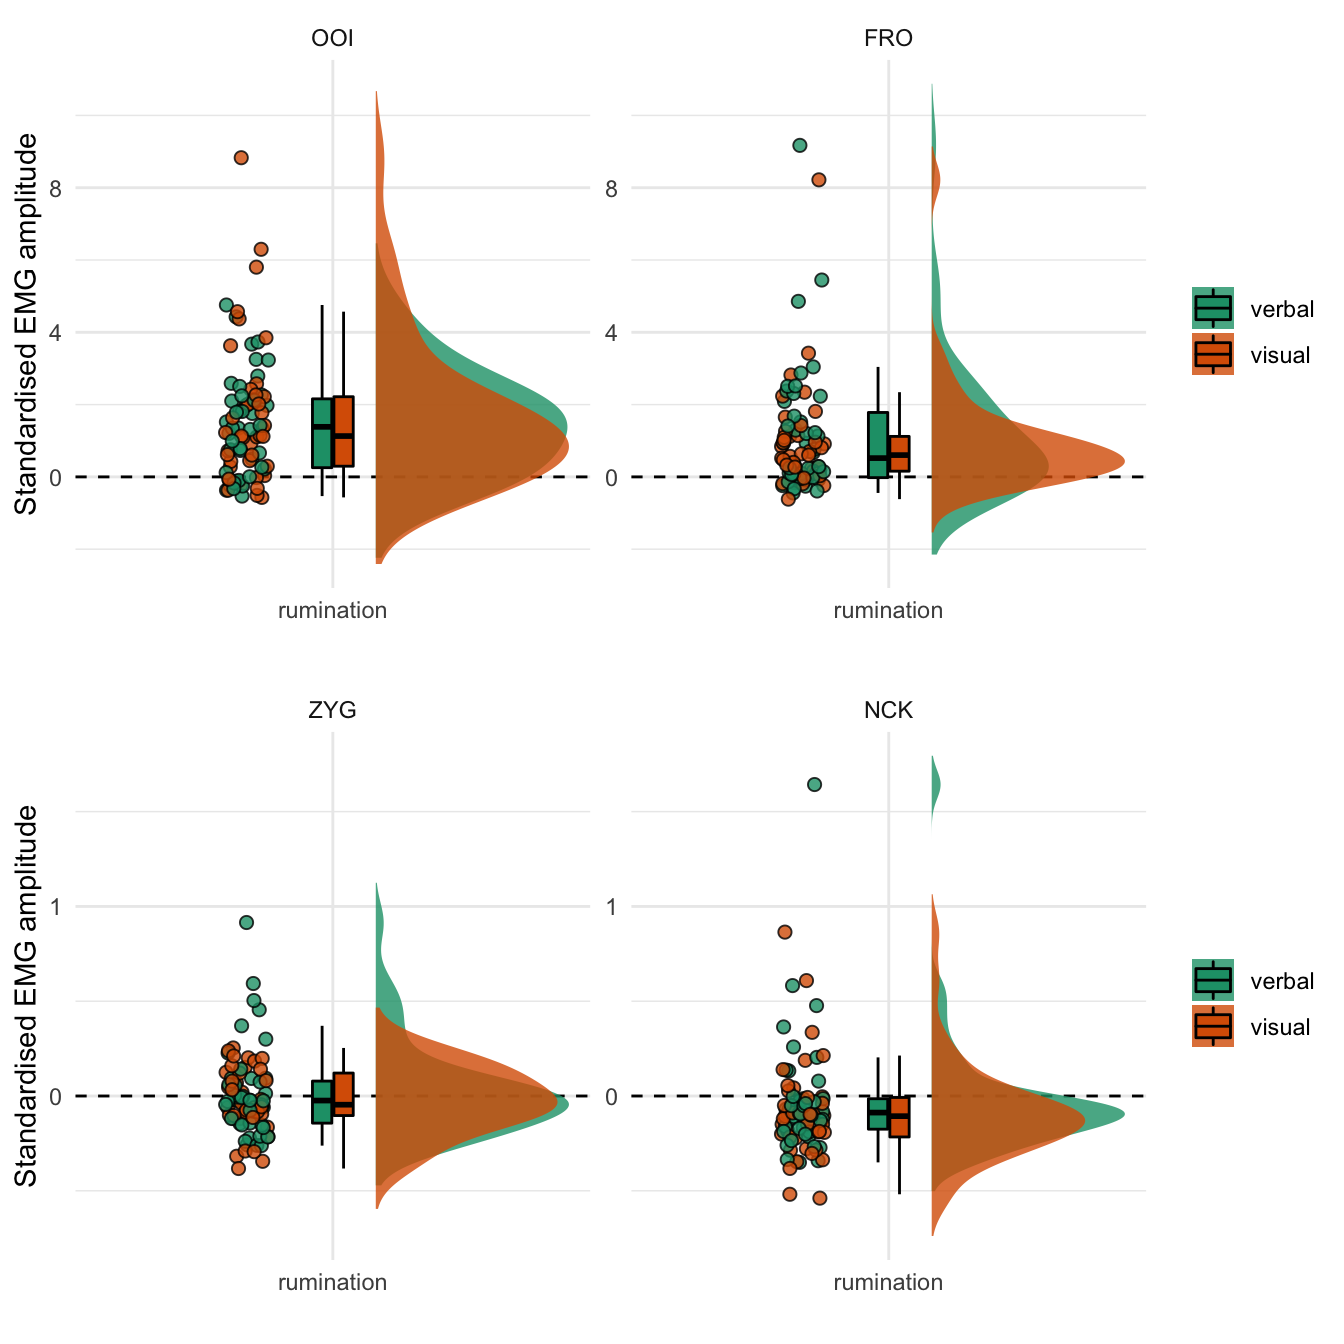
Figure 4.1: Standardised EMG amplitude during the rumination period. The coloured dots represent the mean standardised EMG amplitude by participant and by type of induction. The boxplot represents the median as well as the first and third quartiles. Note: the y-axis differs between the two rows.
4.3.1.2 Confirmatory (preregistered) analyses
In accordance with the preregistered analysis plan, we then fitted a multivariate Gaussian model to estimate the effects of the rumination induction and the difference between the two types of rumination induction. Estimations from this model are reported in Table 4.1.
| Response | Term | Estimate | SE | Lower | Upper | Rhat | BF01 |
|---|---|---|---|---|---|---|---|
| OOI | Intercept | 1.022 | 0.183 | 0.656 | 1.378 | 1.000 | <0.001 |
| ZYG | Intercept | -0.054 | 0.033 | -0.120 | 0.011 | 1.000 | 8.251 |
| FRO | Intercept | 1.504 | 0.184 | 1.131 | 1.861 | 1.000 | <0.001 |
| NEK | Intercept | -0.002 | 0.023 | -0.050 | 0.043 | 1.000 | 41.497 |
| FCR | Intercept | -0.036 | 0.036 | -0.107 | 0.037 | 1.000 | 17.464 |
| OOI | group | 0.209 | 0.341 | -0.466 | 0.904 | 1.000 | 2.469 |
| ZYG | group | 0.065 | 0.066 | -0.066 | 0.193 | 1.000 | 9.332 |
| FRO | group | -0.178 | 0.346 | -0.869 | 0.516 | 1.000 | 2.535 |
| NEK | group | 0.042 | 0.046 | -0.050 | 0.132 | 1.000 | 13.642 |
| FCR | group | 0.092 | 0.072 | -0.048 | 0.235 | 1.000 | 6.094 |
This analysis revealed that the average EMG amplitude of both the OOI and the FRO muscles was estimated to be higher than baseline (the standardised score was above zero) after rumination induction. However, it was not the case for the ZYG, NCK, and FCR muscles. We did not observe the hypothesised difference according to the type of induction on the OOI (\(\beta\) = 0.209, 95% CrI [-0.466, 0.904], BF01 = 2.469) nor on the FRO (\(\beta\) = -0.178, 95% CrI [-0.869, 0.516], BF01 = 2.535).
However, before proceeding further with the interpretation of the results, it is essential to check the validity of this first model. A useful diagnostic of the model’s predictive abilities is known as posterior predictive checking (PPC) and consists in comparing observed data to data simulated from the posterior distribution (e.g., Gelman et al., 2013). Results from this procedure are represented in Figure 4.2.
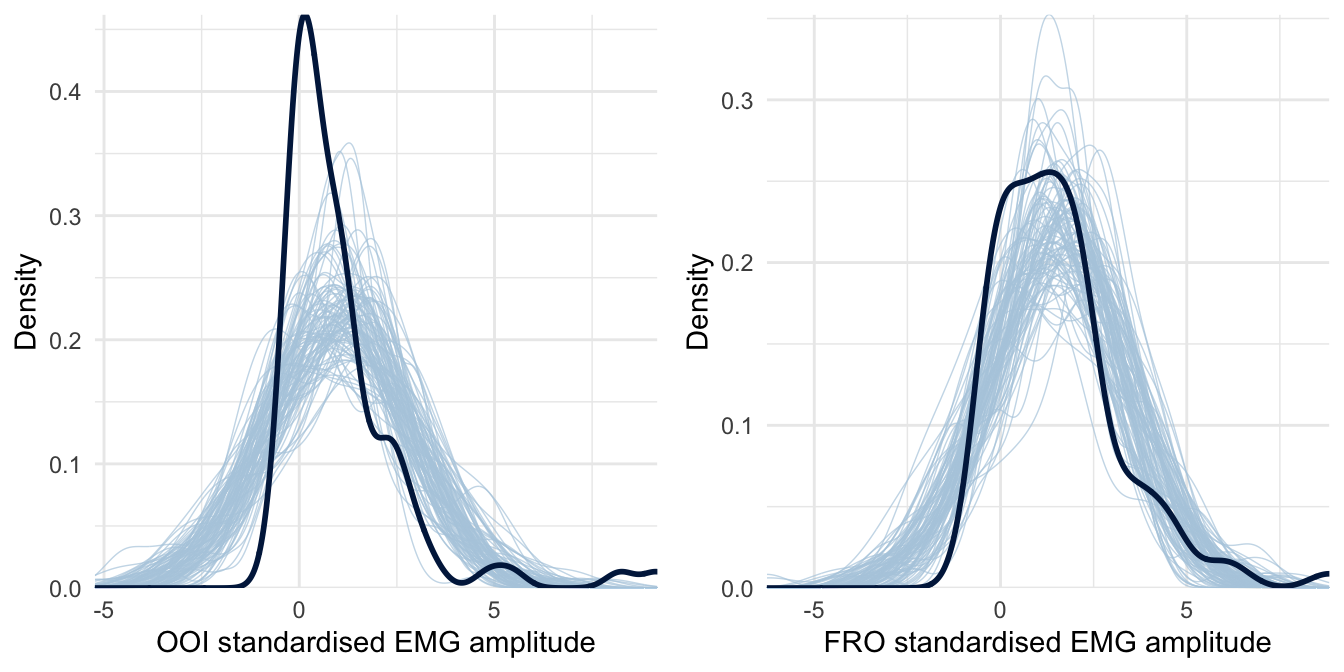
Figure 4.2: Posterior predictive checking for the first model concerning the OOI and FRO muscles. The dark blue line represents the distribution of the raw data while light blue lines are dataset generated from the posterior distribution.
4.3.1.3 Exploratory analyses
The previous figure reveals that this first model fails to generate data that look like the data we have collected. More precisely, the data we have collected look highly right-skewed, especially concerning the OOI. As such, modelling the (conditional) mean of the standardised EMG amplitude is highly sensitive to influential observations, and might not be the best index to evaluate the effects of the type of rumination induction. To improve on this first model, we then assume in the following a Skew-Normal distribution for the response. The Skew-Normal distribution is a generalisation of the Gaussian distribution with three parameters \(\xi\) (xi), \(\omega\) (omega), and \(\alpha\) (alpha) for location, scale, and shape (skewness), respectively. Another limitation of the previous model is that it allocated the same weight to every participant. However, the amount of rejected data differed across participants. For instance, for one participant, we had to remove as much as 95% of their data during the manual artifact removal step (note that the average rejection rate was of 0.36). Such a participant should weigh less in the estimation of the overall effect. In the following models, we weigh the importance of each participant by 1 minus the proportion of signal that was rejected for this participant.30 Estimations from this model are reported in Table 4.2.
| Response | Term | Estimate | SE | Lower | Upper | Rhat | BF01 |
|---|---|---|---|---|---|---|---|
| ZYG | Intercept | -0.035 | 0.040 | -0.112 | 0.048 | 1.000 | 16.401 |
| ZYG | group | 0.087 | 0.066 | -0.045 | 0.220 | 1.000 | 6.443 |
| OOI | Intercept | 1.195 | 0.170 | 0.855 | 1.542 | 1.000 | <0.001 |
| OOI | group | -0.073 | 0.247 | -0.565 | 0.450 | 1.000 | 4.013 |
| NEK | Intercept | -0.005 | 0.031 | -0.065 | 0.058 | 1.000 | 31.357 |
| NEK | group | 0.026 | 0.054 | -0.084 | 0.131 | 1.000 | 16.084 |
| FRO | Intercept | 1.537 | 0.210 | 1.133 | 1.968 | 1.000 | <0.001 |
| FRO | group | -0.030 | 0.313 | -0.700 | 0.588 | 1.000 | 3.194 |
| FCR | Intercept | 0.003 | 0.040 | -0.076 | 0.087 | 1.000 | 24.682 |
| FCR | group | 0.111 | 0.071 | -0.026 | 0.257 | 1.000 | 4.109 |
This analysis revealed that the average EMG amplitude of both the OOI and the FRO muscles was estimated to be higher than baseline (the standardised score was above zero) after rumination induction. However, it was not the case for the ZYG, NCK and FCR muscles. We did not observe the hypothesised difference according to the type of induction on the OOI (\(\beta\) = -0.073, 95% CrI [-0.565, 0.45], BF01 = 4.013) nor on the FRO (\(\beta\) = -0.03, 95% CrI [-0.7, 0.588], BF01 = 3.194). The posterior predictive checks for this model are presented in Figure 4.3 and indicate that this model seems to better accommodate the collected data.
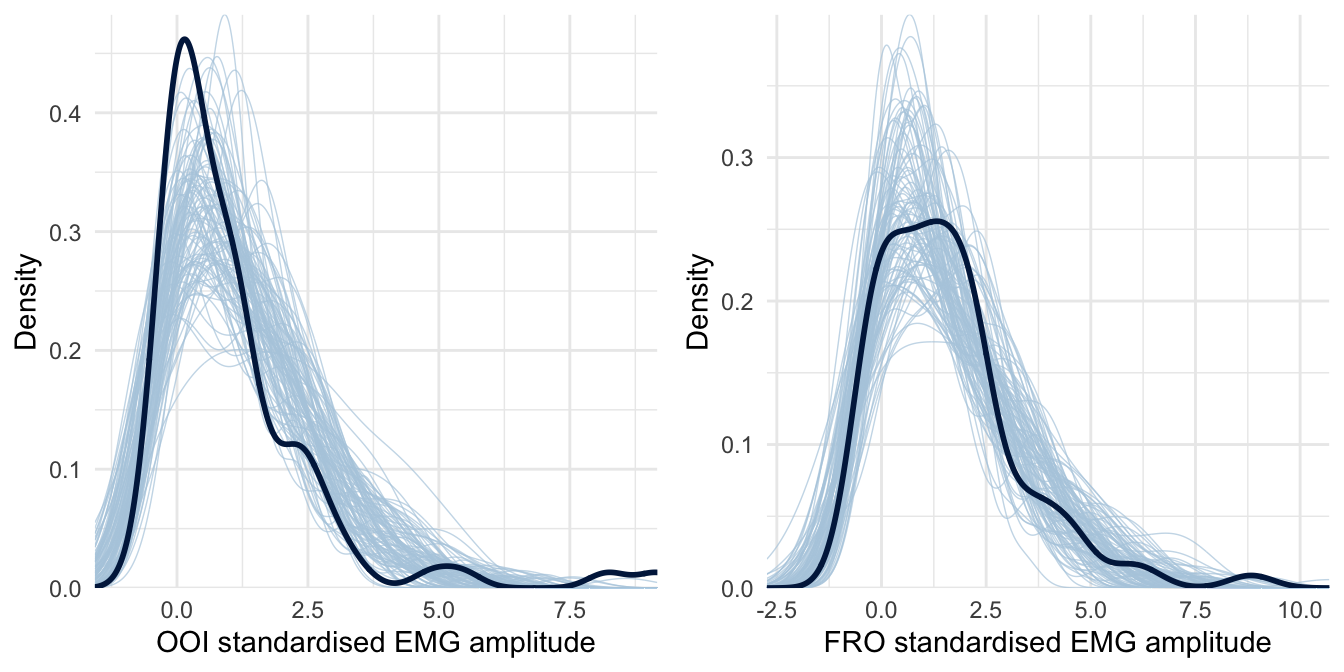
Figure 4.3: Posterior predictive checking for the Skew-Normal model concerning the OOI and FRO muscles. The dark blue line represents the distribution of the raw data while light blue lines are dataset generated from the posterior distribution.
4.3.1.3.1 Cluster analyses
The results of the previous analyses do not corroborate the hypothesis according to which the average EMG amplitude recorded over the speech muscles should be higher in the group that underwent the verbal rumination induction, as compared to the non-verbal rumination induction. However, we might wonder whether the rumination induction was actually efficient in inducing different modalities of ruminative thoughts. To answer this question, we first report the average self-reported levels of either verbal or visual thoughts during the rumination period in Table 4.3.
| Group | Verbal VAS | Visual VAS | Sample size |
|---|---|---|---|
| verbal | 87.45 (2.86) | 31.67 (4.38) | 44 |
| visual | 83.92 (4.04) | 30 (4.53) | 41 |
Considering that both groups showed a similar ratio of verbal/non-verbal thoughts (see Table 4.3), we used these self-reports to define a posteriori groups of participants that reported more verbal (or non-verbal) ruminations. To this end, we used a cluster analysis (2D k-means) to define two groups (clusters) in the space of the two VASs that have been used to assess the amount of verbal and non-verbal thoughts during the rumination period (see Figure 4.4).
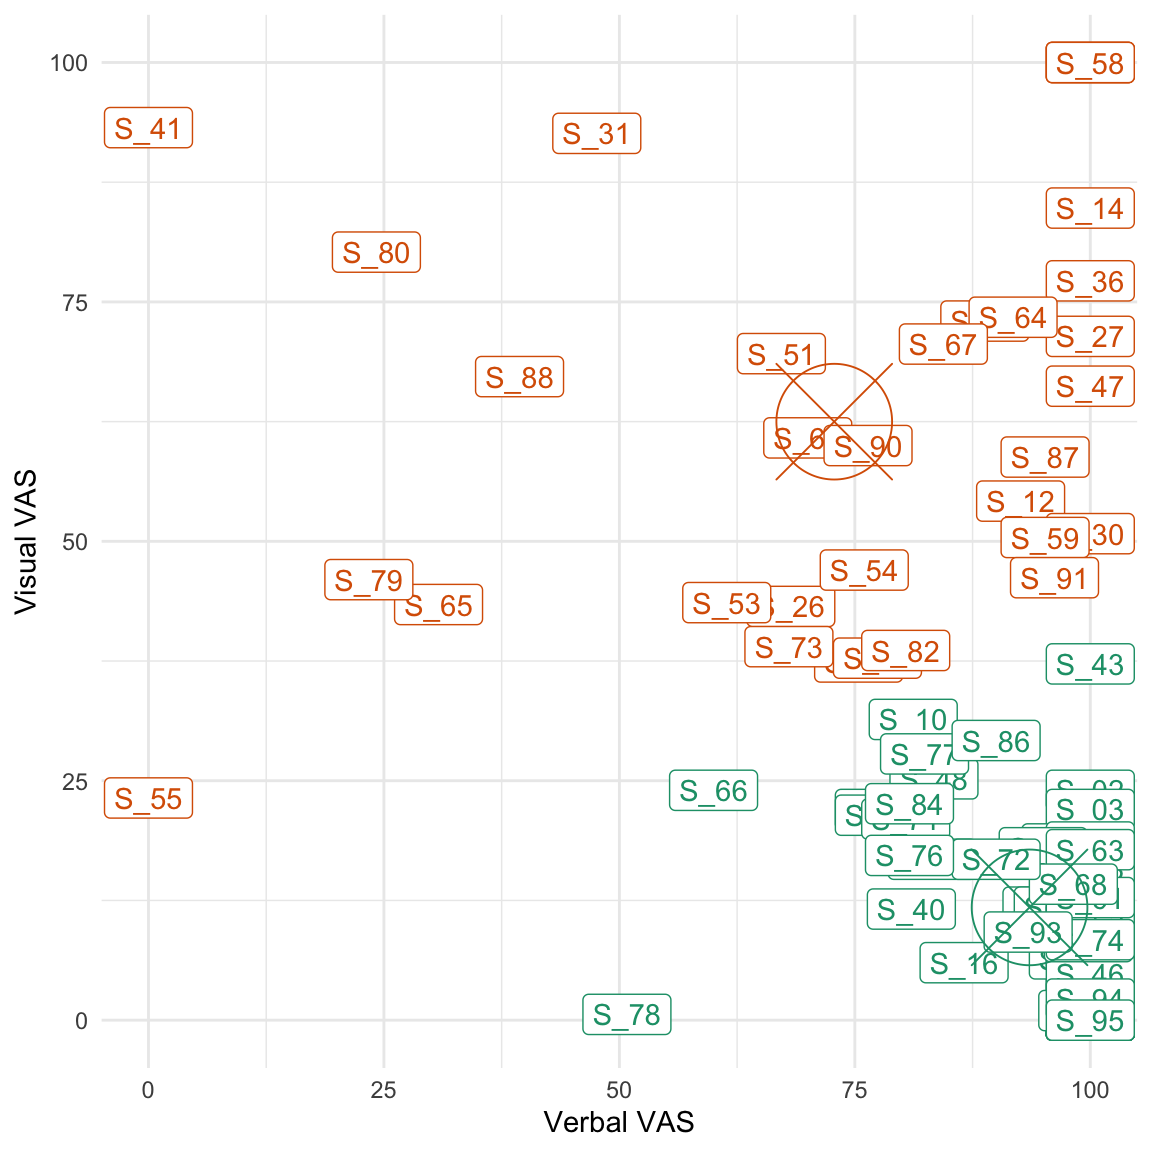
Figure 4.4: Results of the cluster analysis. The centroid of each cluster is represented by a circle and a central cross. The green cluster represents ‘verbal ruminators’ while the orange one represents ‘visual ruminators’.
As can be seen from Figure 4.4 and from Table 4.4, this analysis revealed two groups of participants that were either relatively i) high on the verbal VAS and low on the visual one or ii) high on the visual VAS and low on the verbal one. However, the visual ruminators remained quite high on the verbality scale.
| Cluster | Verbal VAS | Visual VAS | Size |
|---|---|---|---|
| 1 | 93.55 | 11.77 | 53 |
| 2 | 72.81 | 62.49 | 32 |
We then fitted the same model as we previously did but using the cluster (instead of the “group”) as a predictor to assess the influence of the nature of ruminative thoughts on each muscle’ standardised EMG amplitude. Estimations from this model are reported in Table 4.5 and revealed no evidence for a difference between clusters on any muscle (i.e., the \(BF_{01}\) for the effect of cluster was superior to 1 for every muscle).
| Response | Term | Estimate | SE | Lower | Upper | Rhat | BF01 |
|---|---|---|---|---|---|---|---|
| ZYG | Intercept | -0.032 | 0.041 | -0.110 | 0.053 | 1.000 | 17.005 |
| ZYG | cluster | -0.005 | 0.069 | -0.148 | 0.131 | 1.000 | 14.664 |
| OOI | Intercept | 1.196 | 0.174 | 0.855 | 1.553 | 1.000 | <0.001 |
| OOI | cluster | -0.037 | 0.253 | -0.571 | 0.485 | 1.000 | 3.915 |
| NEK | Intercept | 0.004 | 0.031 | -0.056 | 0.066 | 1.000 | 32.501 |
| NEK | cluster | -0.071 | 0.052 | -0.177 | 0.037 | 1.000 | 7.382 |
| FRO | Intercept | 1.626 | 0.210 | 1.210 | 2.047 | 1.000 | <0.001 |
| FRO | cluster | -0.584 | 0.348 | -1.302 | 0.102 | 1.000 | 0.708 |
| FCR | Intercept | 0.004 | 0.042 | -0.078 | 0.090 | 1.000 | 24.173 |
| FCR | cluster | 0.018 | 0.073 | -0.127 | 0.163 | 1.000 | 13.835 |
4.3.1.3.2 Relation between self-reports and EMG amplitude
We represent the relation between self-reported levels of state rumination (after induction) and the EMG amplitude (of the four facial muscles) changes from baseline to post-induction in Figure 4.5. This figure reveals an overall positive association between the level of self-reported state rumination after induction and the increase in EMG amplitude from baseline to post-induction on the FRO muscle, but not substantial relation concerning the other muscles.
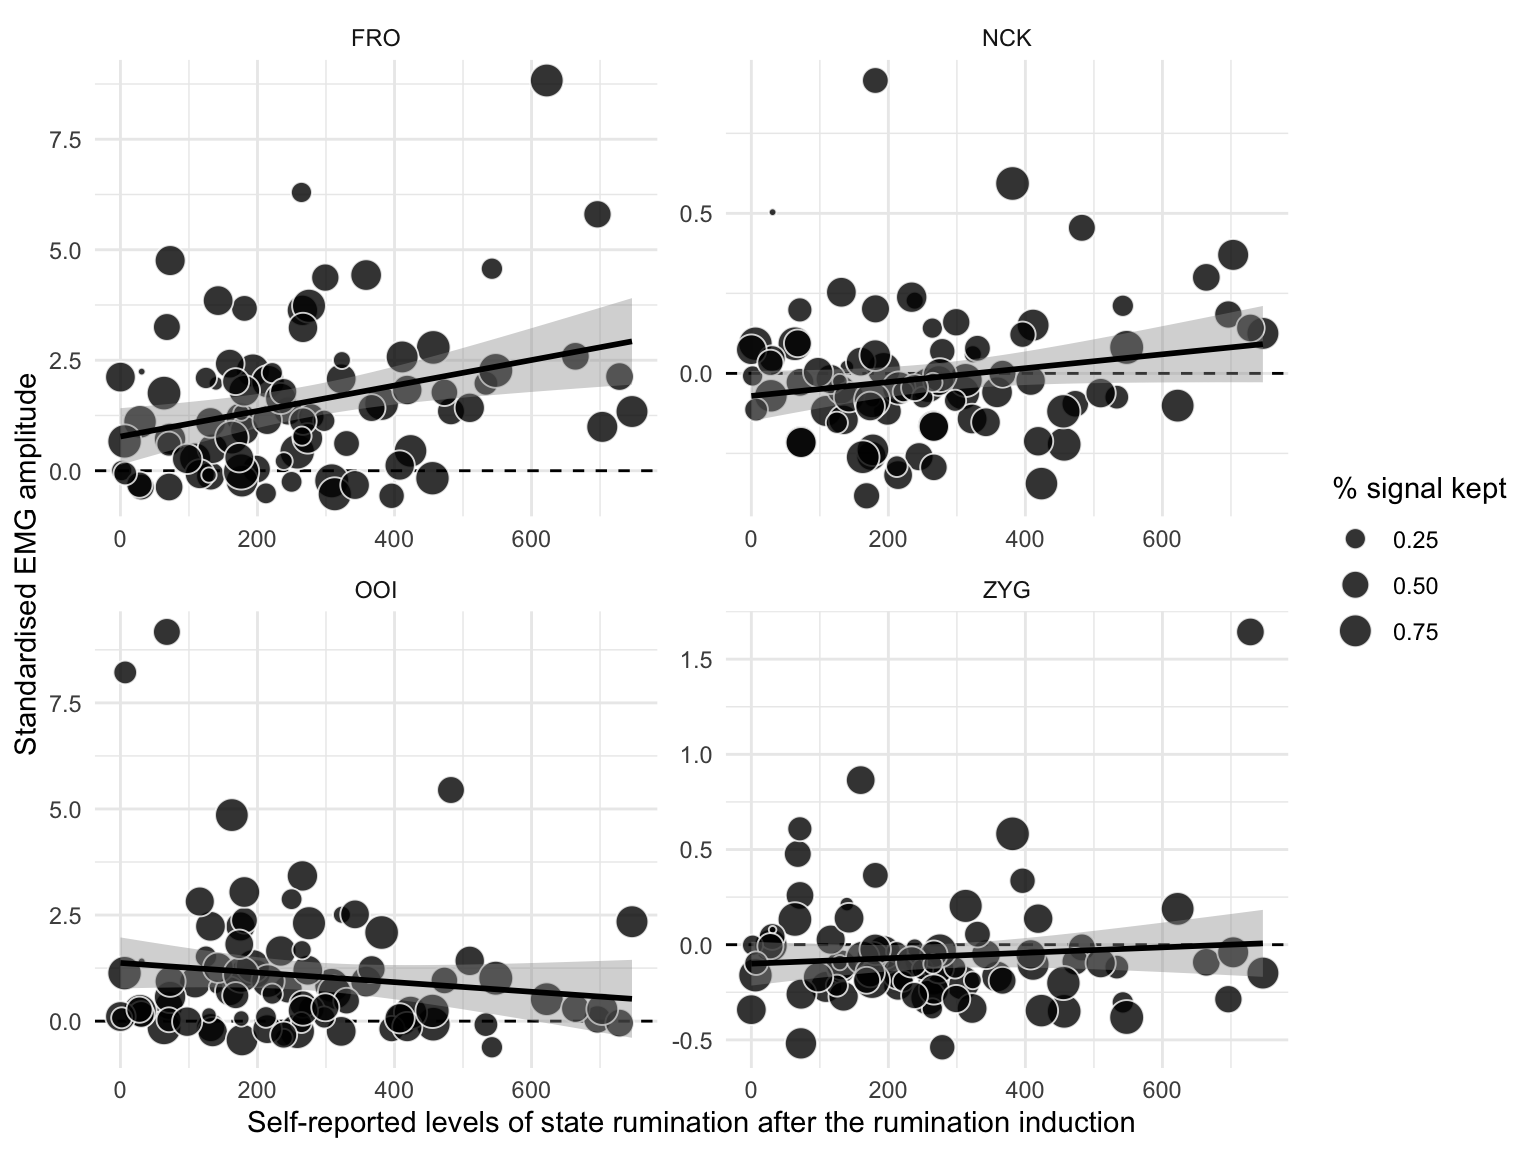
Figure 4.5: Relation between self-reported levels of state rumination (on the x-axis) and standardised EMG amplitude after the rumination induction (on the y-axis). The dots represent individual observations, whose size varies with the percentage of signal that was kept after removing artifacts. The black line represents the regression line with its 95% CI.
To further analyse the relationship between self-reported levels of state rumination and standardised EMG amplitude, we fitted a weighted multivariate Skew-Normal model (as previously). Estimations from this model are reported in Table 4.6.
| Response | Term | Estimate | SE | Lower | Upper | Rhat | BF01 |
|---|---|---|---|---|---|---|---|
| ZYG | Intercept | -0.032 | 0.041 | -0.112 | 0.051 | 1.000 | 17.092 |
| ZYG | bsri | 0.004 | 0.034 | -0.061 | 0.070 | 1.000 | 29.882 |
| OOI | Intercept | 1.187 | 0.170 | 0.860 | 1.536 | 1.000 | <0.001 |
| OOI | bsri | -0.063 | 0.130 | -0.321 | 0.195 | 1.000 | 7.061 |
| NEK | Intercept | -0.006 | 0.030 | -0.063 | 0.058 | 1.000 | 33.05 |
| NEK | bsri | 0.030 | 0.030 | -0.027 | 0.092 | 1.000 | 19.442 |
| FRO | Intercept | 1.523 | 0.208 | 1.126 | 1.957 | 1.000 | <0.001 |
| FRO | bsri | 0.283 | 0.192 | -0.097 | 0.660 | 1.000 | 1.805 |
| FCR | Intercept | 0.000 | 0.041 | -0.079 | 0.086 | 1.000 | 24.845 |
| FCR | bsri | 0.048 | 0.035 | -0.023 | 0.116 | 1.000 | 11.079 |
This analysis revealed a weak positive association between self-reported levels of state rumination (BSRI score) after induction and the standardised EMG amplitude recorded over the FRO muscle (\(\beta\) = 0.283, 95% CrI [-0.097, 0.66], BF01 = 1.805). This analysis revealed no evidence for an association between self-reported levels of state rumination and the standardised EMG amplitude recorded over the other muscles.
In summary, while successful in inducing higher levels of state rumination (higher BSRI scores), the rumination induction did not permit to induce rumination in different modalities. When examining a posteriori groups of verbal vs. visual ruminators, we did not find evidence for specific electromyographic correlates. However, it should be noted that participants who were a posteriori included in the visual group were also high on the verbality scale. Interestingly, we observed a weak positive correlation between self-reported levels of state rumination and the standardised EMG amplitude of the FRO (see supplementary materials for additional analyses).
4.3.2 Effects of the relaxation
4.3.2.1 Planned (preregistered) analyses
We hypothesised that an orofacial relaxation should cause a stronger decrease of state rumination than a relaxation targeting the arm, for the participants that went through a verbal rumination induction, in comparison to a non-verbal rumination induction. In other words, we expected an interaction effect between the type of rumination induction and the type of relaxation. As the relaxation was directly targeted at the facial muscles, we did not expect the overall EMG amplitude to be a reliable index of ongoing rumination in this part of the experiment. Therefore, we only report an analysis of the self-reported levels of state rumination (but see the supplementary materials for additional analyses).
To analyse this interaction effect, we fitted a Gaussian model with a constant effect of group (verbal vs. non-verbal rumination induction) and relaxation (orofacial vs. arm relaxation) to predict the difference in BSRI score (after minus before the relaxation). Estimations from this model are reported in Table 4.7.
| Term | Estimate | SE | Lower | Upper | Rhat | BF01 |
|---|---|---|---|---|---|---|
| Intercept | -92.07 | 13.72 | -119.37 | -64.96 | 1.00 | <0.001 |
| group | 0.94 | 27.06 | -50.68 | 55.06 | 1.00 | 3.69 |
| relax_type | 25.09 | 26.75 | -29.34 | 76.67 | 1.00 | 2.405 |
| group:relax_type | 25.45 | 47.88 | -73.75 | 118.19 | 1.00 | 1.846 |
This analysis revealed a general decrease in self-reported levels of state rumination after relaxation (\(\beta\) = -92.069, 95% CrI [-119.371, -64.96], BF01 < 0.001) but no substantial interaction effect with the relaxation type or the induction type (all \(BF_{01}\) were superior to 1). As two-way and three-way interaction terms are difficult to interpret numerically, we represent the raw data along with the model predictions in Figure 4.6. This Figure supports the conclusion that we did not observe any interaction effects (the line were parallel and with similar slopes across panels).
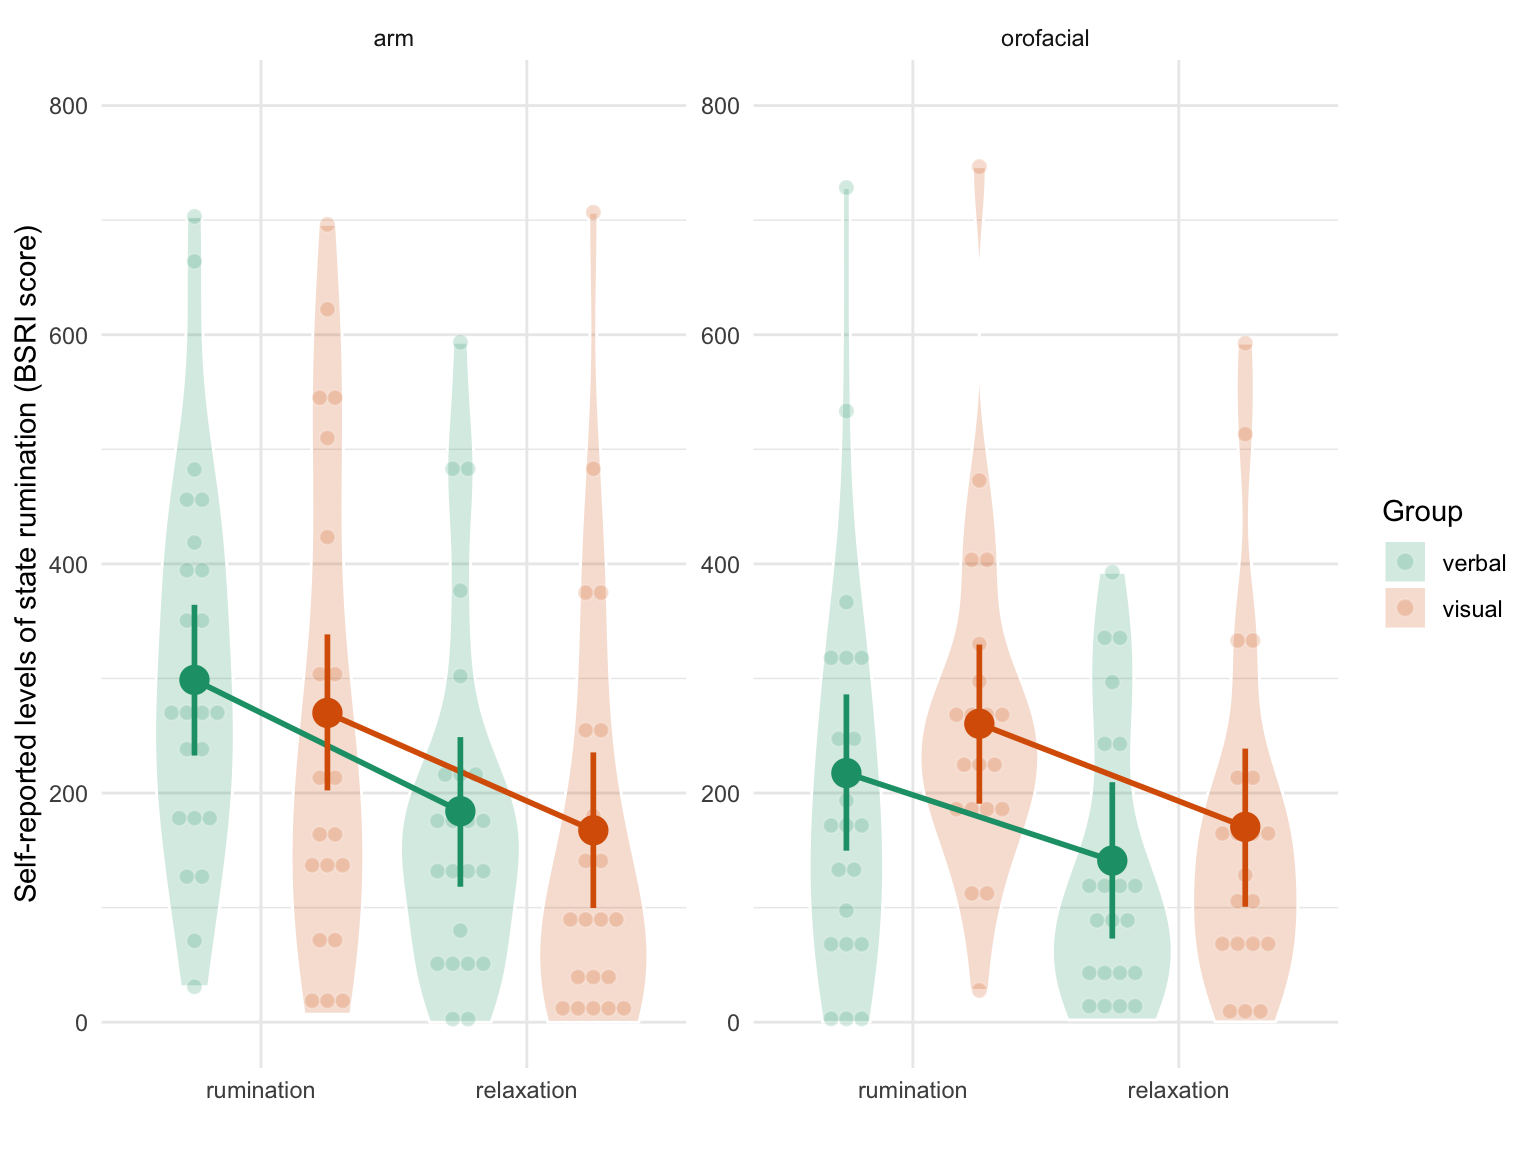
Figure 4.6: Self-reported levels of state rumination (BSRI score) by condition. The left panel depicts results in the orofacial relaxation group while the right panel depicts results in the arm relaxation group. Verbal ruminators are represented in green whereas non-verbal ruminators are represented in orange. Individual observations (each participant) are represented by the smaller coloured dots whereas estimated means and 95% CrI are represented by the bigger surimposed coloured circles and vertical error bars.
The three way interaction term (the last line of Table 4.7) indicates that the interaction between condition (time) and the type of relaxation was slightly different according to the type of induction type (\(\beta\) = 25.447, 95% CrI [-73.748, 118.19], BF01 = 1.846). However, the large uncertainty associated with this three-way interaction effect (as expressed by the SE and the width of the credible interval) prevents any strong conclusion. Moreover, the sign of the BF supports the null hypothesis (although weakly in magnitude).
To sum up, we did not find evidence for an interaction effect between the type of induction (verbal vs. non verbal) and the type of relaxation (orofacial versus arm) on the self-reported levels of state rumination. We turn now to a general summary and discussion of the overall results.
4.4 Discussion
With this study we aimed to replicate and extend previous findings showing that induced rumination was associated with increased facial muscular activity as compared to rest (Nalborczyk et al., 2017). More precisely, we tried to disentangle the facial electromyographic correlates of induced rumination that were related to either i) rumination as a kind of inner speech or ii) rumination as a state of pondering on negative affects. To this end, we compared two types of rumination induction. The first one was designed to specifically induce rumination in a verbal modality, whereas the second one was designed to induce rumination in a visual imagery modality. Following the motor simulation view of inner speech production, we hypothesised that the verbal rumination induction should result in higher activity in the speech-related muscles than the non-verbal rumination induction. At the same time, forehead muscular activity should vary consistently (i.e., should not differ) across conditions, as both conditions were expected to induce similar levels of negative affects. Following the motor simulation view as well as previous observations (Nalborczyk et al., 2017), we also hypothesised that a relaxation focused on the orofacial area should be more efficient in reducing rumination (when experienced in a verbal modality) than a relaxation focused on a non-orofacial area (i.e., the arm).
To examine these hypotheses, it was crucial to first show that i) the rumination induction was successful in inducing rumination and ii) that the two types of rumination induction were effectively inducing different types of rumination (i.e., verbal vs. non-verbal rumination). Although our results show that the rumination induction was successful in inducing rumination (as expressed by the increase in self-reported state rumination), it failed to induce rumination in different modalities. That is, there was no difference in self-reported levels of verbal vs. non verbal thoughts, and no substantial difference in the facial EMG correlates across conditions. Moreover, even when defining groups of verbal vs. visual ruminators a posteriori (i.e., based on the self-reports), these two groups were not discriminable by their facial EMG recordings. However, it should be noted that both a posteriori groups of participants were high on the verbality scale. In addition, self-reported levels of state rumination were only (positively) related to the EMG amplitude of the forehead muscle (FRO), but were not related to the activity of the other facial muscles. In the second part of the experiment, comparing the two types of relaxation (either focused on the orofacial area or on the arm) revealed no difference in terms of their impact on state rumination, whatever the type of rumination induction participants went through. We discuss each of these results in the following sections.
4.4.1 Inducing rumination in different modalities
Based on the self-reports of verbal and visual thoughts assessed at the end of the rumination period (cf. Table 4.3), both induction types lead to similar ratios of verbal to visual self-reported rumination. However, the fact that we did not find modality-specific electromyographic correlates of rumination when contrasting a posteriori groups of participants still poses a challenge to the motor simulation view. In a recent attempt to bridge response styles theories of trait rumination (Nolen-Hoeksema, 1991) and control theory accounts of state rumination (Martin & Tesser, 1996), rumination has been defined as a mental habit (Watkins & Nolen-Hoeksema, 2014). In this framework, self-focused repetitive thoughts (such as rumination) are triggered by goal discrepancies (i.e., discrepancies between an initial goal and the current state) and can become habitual behavioural responses to certain contextual cues. More precisely, rumination can become habitual through a process of “automatic association between the behavioral response (i.e., repetitive thinking) and any context that occurs repeatedly with performance of the behavior (e.g., physical location, mood), and in which the repetitive thought is contingent on the stimulus context” (Watkins & Nolen-Hoeksema, 2014).
Habitual behaviours are more automatic that non-habitual behaviours, they are less conscious and are often less controllable. In other words, frequent ruminators do not willingly engage in ruminative thinking. Instead, rumination might be triggered by contextual cues such as a negative mood, without the explicit evocation of a goal (or discrepancy toward this goal). According to a recent neurocognitive model of inner speech production (Lœvenbruck et al., 2018), inner speech is considered as an action on its own (as overt speech is), except that multimodal sensory consequences of speech are simulated. This model also suggests that different forms of inner speech might involve the speech motor system to a different extent (Grandchamp et al., 2019; Lœvenbruck, 2019). More precisely, highly expanded forms of inner speech (e.g., subvocally rehearsing a phone number) are hypothesised to recruit the speech apparatus to a greater extent than more evasive and more condensed forms of inner speech. Accordingly, we speculate that rumination might be considered as a spontaneous (in opposition to deliberate) form of inner speech that does not require a full specification of articulatory features.
If this hypothesis is correct, namely if rumination usually take a more condensed form, we should not expect to observe peripheral muscular activity during rumination. Consequently, we need to explain the increased EMG amplitude recorded over the OOI after the rumination induction that was observed in this experiment (but also in Nalborczyk et al., 2017). Given that the level of activity in OOI increased more than that in ZYG after rumination induction, two interpretations are possible. First, it could be that OOI reflects some implication of the speech motor system related to rumination. Even though rumination is presumably expressed in a condensed form, it might contain some fully expanded instances. The fact that the activity in the ZYG did not increase could be explained by its weak involvement in non hyper-articulated speech production (a finding also obtained by Rapin et al., personal communication). The fact that the increase in OOI activity is not proportional to the degree of self-reported state rumination could be due to the fact that condensed instances of rumination overweigh the more expanded instances. A second interpretation could be that the OOI activity reflects in fact negative mood (cf. Ekman’s action units 22, 23, 24) or cognitive effort (van Boxtel & Jessurun, 1993; Waterink & van Boxtel, 1994). The stability in the level of activity of the ZYG muscle is compatible with this second interpretation.
Finally, another explanation for the absence of modality-specific EMG correlates might come from previous studies using surface EMG to investigate inner speech production. As summarised in the previous section, our results do not support theoretical predictions of the motor simulation view, according to which it should be possible to discriminate the content of inner speech (and rumination) based on peripheral muscular activation. Nevertheless, the outcome of the present study is consistent with the results reported by Meltzner et al. (2008). These authors were able to obtain high classification accuracies during both overt and mouthed speech but not during covert speech (despite the fact that they used eleven sensors on the neck and the lower face).
However, the results of Meltzner et al. (2008) (and ours) stand in sharp contrast with classical results about the electromyographic correlates of inner speech production (e.g., McGuigan & Dollins, 1989; McGuigan & Winstead, 1974; Sokolov, 1972) as well as more recent developments. For instance, Kapur et al. (2018) developed a wearable device composed of seven surface EMG sensors that can attain a 92% median classification accuracy in discriminating internally vocalised digits. However, these discrepant results could be explained by differences in the research methodology employed by these different teams (see discussion in Nalborczyk et al., in preparation). Indeed, the between-subject nature of the designs investigating the effects of induced rumination might hamper the possibility of highlighting modality-specific EMG correlates of induced rumination. Because (surface) electromyography is only a noisy indicator of inner speech production, decoding the content of inner speech based on such signals require multiple measurements per individual, and possibly participant-specific recording characteristics. Therefore, the lack of modality-specific EMG correlates might also be explained by a lack of sensitivity of the design we describe in the current article.
We think this possibility might be examined by looking at the results obtained in the second part of the experiment. If the absence of modality-specific EMG correlates is only due to a lack of sensitivity, state rumination should still be more disrupted by an orofacial relaxation than by a non-orofacial relaxation.
4.4.2 Modality-specific and effector-specific relaxation effects
Contrary to our predictions, we did not observe the interaction effect between the type of rumination induction (verbal vs. non-verbal) and the type of relaxation (orofacial relaxation vs. arm relaxation). This null result also persisted when considering the interaction between the a posteriori cluster and the type of relaxation (see supplementary materials). Moreover, BF-based hypothesis testing revealed no evidence for a difference between the two types of relaxation31 (cf. Table 4.7 and Figure 4.6). However, looking in more details into the estimations from this model reveals that the arm relaxation was estimated to be more efficient than the orofacial relaxation in reducing self-reported levels of state rumination (BSRI scores). More precisely, the difference between the two types of relaxations was estimated to be of around 25 points on the scale of the BSRI sum score, although the large uncertainty associated with this estimation prevents any strong conclusion.
Interestingly, these results are contradicting those of Nalborczyk et al. (2017), who observed a stronger decrease in self-reported state rumination following the orofacial relaxation than the arm relaxation. However, it should be noted that both the results of Nalborczyk et al. (2017) and the results reported in the current article are based on comparisons involving relatively low sample sizes (two groups of around 20 participants and two groups of around 40 participants, respectively). As such, these results should be considered at most as suggestive.
Nevertheless, the high similarity between these two studies warrants a meta-analytical way of thinking about their results. In other words, given that both studies used a similar rumination induction and the same relaxation recordings, we can compute an average effect size across these two studies to get a more accurate estimate of the population effect size. The effect size (pooled Cohen’s d) for the difference between the two types of relaxation was of \(\delta\) = -0.498 (95% CI [-1.095, 0.098]) in Nalborczyk et al. (2017) and of \(\delta\) = 0.217 (95% CI [-0.216, 0.65]) in the current article. Because the current study has a larger sample size, the uncertainty (the width of the CI) about the value of the Cohen’s d is smaller. Therefore, weighting both estimates by their respective standard error reveals an average effect size that is very close to zero (\(\delta\) = -0.052).
To sum up, we did not observe a stronger effect of the orofacial relaxation (when compared to the non-orofacial relaxation) and we did not observe the hypothesised interaction effect between the type of rumination induction and the type of relaxation. Moreover, we also did not observe an interaction between the type of rumination induction and the clusters defined a posteriori (see supplementary materials). These results taken together corroborate the hypothesis formulated previously, according to which rumination –as a mental habit (Watkins & Nolen-Hoeksema, 2014)– could be considered as a strongly internalised and condensed form of inner speech. As such, ruminative thinking would not require the involvement of the speech motor system. Therefore, rumination is not expected to be disrupted by motor interferences such as relaxation or articulatory suppression (Nalborczyk et al., 2018).
4.4.3 Conclusions
We aimed to evaluate whether rumination is better described as a form of inner speech that requires the motor simulation of speech production, or as a rather abstract and articulatory impoverished form of inner speech. In the first case, verbal rumination should be accompanied by an activation of the speech muscles and should be disrupted by motor interference directed at the speech muscles. To examine these hypotheses, we extended a previous study (Nalborczyk et al., 2017) and compared two types of rumination induction designed to elicit either verbal or non-verbal (visual) rumination.
In the first part of the experiment, we replicated the findings of Nalborczyk et al. (2017) by showing that both the activity of the forehead (FRO) and the activity of the lip (OOI) was higher than baseline after a rumination induction (averaging across the two types of rumination induction). However, we failed to find distinct EMG correlates when comparing the two types of rumination induction or when comparing two (a posteriori defined) groups of verbal vs. visual ruminators (although both groups showed a relatively high levels of verbal thoughts). Moreover, only the activity of the forehead was related to self-reported state rumination. In the second part of the experiment, we did not observe the hypothesised interaction effect between the type of induction and the type of relaxation. More precisely, following the motor simulation view of inner speech production, we expected to observe a stronger decrease in self-reported state rumination following an orofacial relaxation than a non-orofacial relaxation, when rumination was expressed in a verbal modality (as compared to a non-verbal modality). This prediction was not supported by the data. Taken together, these results suggest that verbal rumination is a somehow impoverished form of inner speech that is not fully specified at an articulatory level.
We speculated that this observation might be explained by the degree of automaticity that usually accompanies rumination. Following the mental habit view of rumination (Watkins & Nolen-Hoeksema, 2014), rumination can be considered as an habitual mode of response to contextual cues (e.g., negative mood). As such, it can be considered as a non-intentional (or weakly intentional) form of inner speech. Thus, the absence of modality-specific correlates of verbal rumination is congruent with the observation that inner speech is more strongly accompanied by peripheral muscular activation when expressed intentionally or under adverse conditions (e.g., Sokolov, 1972).
Some limitations are worth keeping in mind when interpreting these results. First, the current sample only consisted of female participants. Whereas it permitted to maximise the probability of effectively inducing rumination, it also limits the generalisability of these findings. Second, although the rumination induction resulted in slightly different levels of self-reported levels of verbal thoughts, this difference was weak. Instead of inducing rumination in different modalities, a more fruitful strategy to compare the consequences of verbal vs. non-verbal rumination might be to induce rumination in the “preferred” modality of the participant. We might recruit participants with a propensity to ruminate preferentially in one of those modalities and present them with a classical rumination induction procedure. This would arguably increase the contrast between the two type of inductions and the probability of observing modality-specific EMG correlates, if any.
Nevertheless, these results provide relevant information for both the study of repetitive negative thinking (including rumination) and the study of inner speech. On the first hand, the strong internalisation and condensation of verbal rumination speaks in favour of the conception of rumination as a mental habit (Watkins & Nolen-Hoeksema, 2014). On the other hand, the modulation of the involvement of the speech motor system during inner speech by its degree of automaticity is congruent with previous observations. However, these results still need to be replicated and further developed before being incorporated into integrative neurocognitive models of inner speech production.
4.5 Supplementary materials
Pre-registered protocol, open data, supplementary analyses as well as reproducible code and figures are available at https://osf.io/c9pag/.
Many packages have been used for the writing of this paper, among which the BEST, patchwork and ggplot2 packages for plotting (Kruschke & Meredith, 2018; Pedersen, 2017; Wickham et al., 2018), the tidybayes and sjstats packages for data analysis (Kay, 2018; Lüdecke, 2018), the biosignalEMG and R.matlab packages for signal processing (Bengtsson, 2016; Guerrero & Macias-Diaz, 2018), as well as the glue and tidyverse packages for code writing and formatting (Hester, 2017; Wickham, 2017).
4.6 Acknowledgements
This project was funded by the ANR project INNERSPEECH (grant number ANR-13-BSH2-0003-01). LN was funded by a PhD fellowship from Univ. Grenoble Alpes. We thank Nathalie Vallet for recording the relaxation sessions.
This experimental chapter is a working manuscript reformatted for the need of this thesis. Source: Nalborczyk, L., Banjac, S., Baeyens, C., Grandchamp, R., Koster, E.H.W., Perrone-Bertolotti, M., & Lvenbruck, H. (in preparation). Dissociating facial electromyographic correlates of visual and verbal induced rumination. Pre-registered protocol, preprint, data, as well as reproducible code and figures are available at: https://osf.io/c9pag/.↩
An introduction to Bayesian statistical modelling is outside the scope of the current paper but the interested reader is referred to Nalborczyk et al. (2019a), for an introduction to Bayesian multilevel modelling using the
brmspackage.↩This method simply consists in taking the ratio of the posterior density at the point of interest divided by the prior density at that point (Wagenmakers, Lodewyckx, Kuriyal, & Grasman, 2010).↩
Technically, what is weighed is the contribution of the observation to the likelihood function.↩
Neither did it reveal evidence for a difference, as the BF was close to 1. A Bayes factor around 1 means that the observed data is similarly likely to appear under both the hypothesis of an effect being different from zero and the hypothesis of a null effect. Moreover, it should be noted that BFs are extremely dependent on prior assumptions. As such, the obtained BFs might vary substantially by varying the prior assumptions of the fitted models.↩